At Edge Quad, we empower users to effectively leverage our BI and data visualization services, leading to better insights and more informed decision-making.
Interested in learning more about our IT services? Contact us today to schedule a consultation with one of our experts.
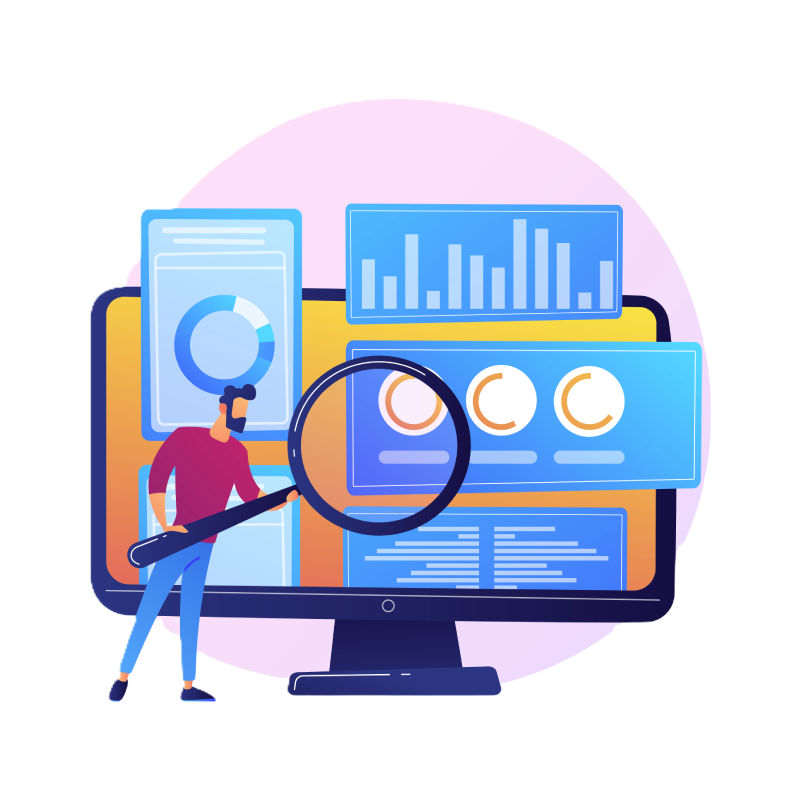
We specialize in transforming data into practical insights, highlighting opportunities through advanced analytics and visualization


Designed to provide specific data insights and visualizations tailored to the roles and responsibilities of different users within an organization description.
Designed to display the most relevant and critical metrics for evaluating the performance and success of a business or project.
Designed to streamline processes by providing standardized formats and structures that are relevant to the specific field, ensuring consistency and efficiency.
Designed to control access to data and report across all levels of users, groups, and customers.
Designed to be intuitive and user-friendly, ensuring that users can quickly find the information or tools they need to address their specific issues.
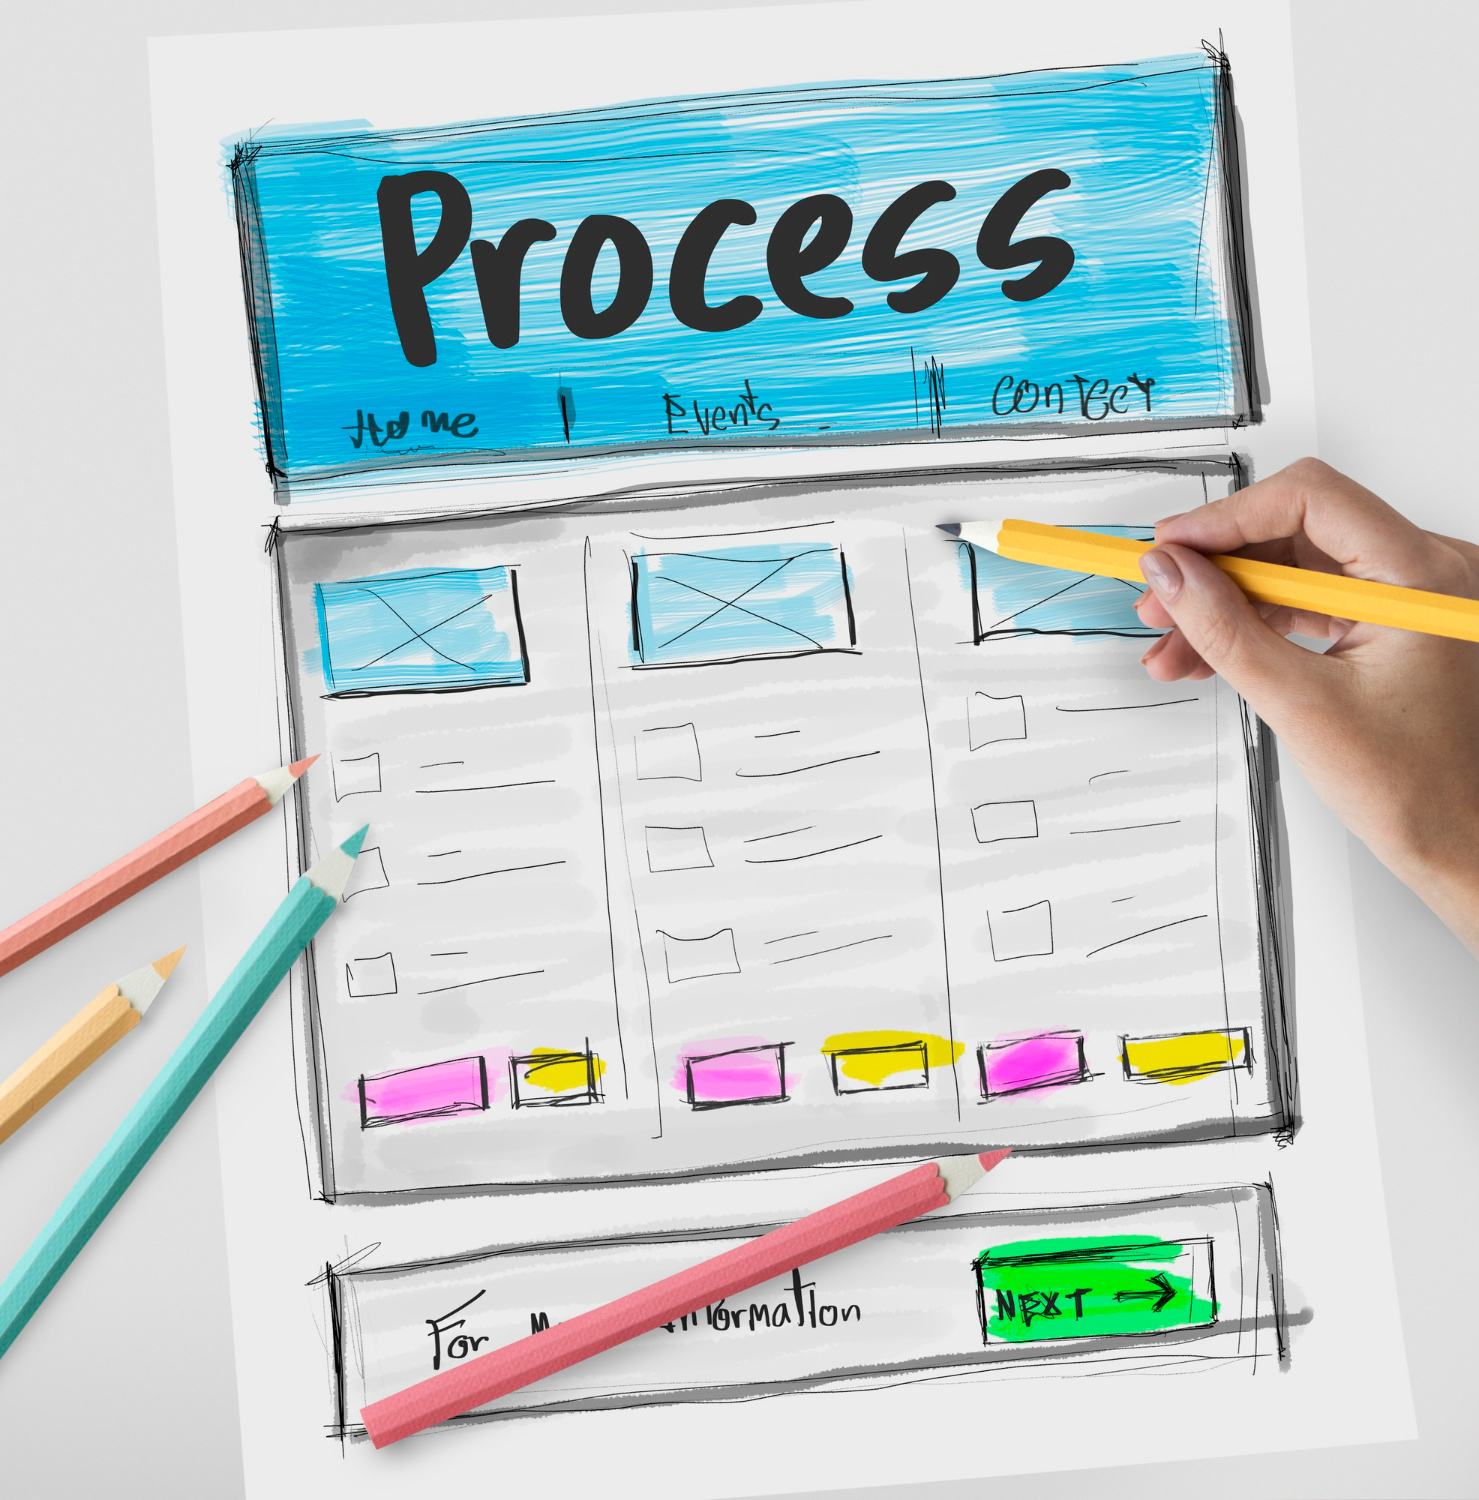
We start by comprehending your organizational objectives, then profile the source data to understand its context, and finally develop wireframes for your review.
Our approach includes setting up, designing, and developing the dimensional model, followed by thorough testing to ensure the KPIs and metrics are valid.
Our iterative design process includes quickly creating an initial prototype and refining it through UAT cycles before delivering the final version.
Our approach involves handing over process documentation to the customer, offering end-user skill development, and providing support for the solution we implement.

Integrating BI modules into your existing infrastructure, we enhance analytics capabilities, provide superior data visualization, and improve report quality.

We offer consulting services to support your company in crafting a results-oriented plan for data management and BI implementation

We assist with data cleansing, preparation, and anomaly elimination to ensure your business intelligence software consistently produces reliable results.

We design intuitive dashboards and interactive reports that provide performance insights in a clear and digestible format for swift decision-making.

We help to adopt self-service BI tools can greatly empower your team to make informed, data-driven decisions.

We will refine your data architecture and reports for optimal performance, ensuring they load quickly and are efficiently used by your entire team.


 SUBSCRIBE OUR NEWSLETTER!

© Copyright 2025 . My Web Lane